When a groom comes to theblacktux.com, we need the following pieces of information to process their Rental:
– The event date (their wedding day!)
– What tux or suit they want to rent (e.g., shawl collar tuxedo, notch collar tuxedo, navy suit)
– What other items or add-ons they want to rent (e.g., shoes, pocket square, cufflinks)
– The price of each item
– The number of groomsmen in their wedding party and what they are required to wear (the same tux? The same tux and shirt and shoes? A different suit?)
– Shipping address for the groom and each of the groomsmen
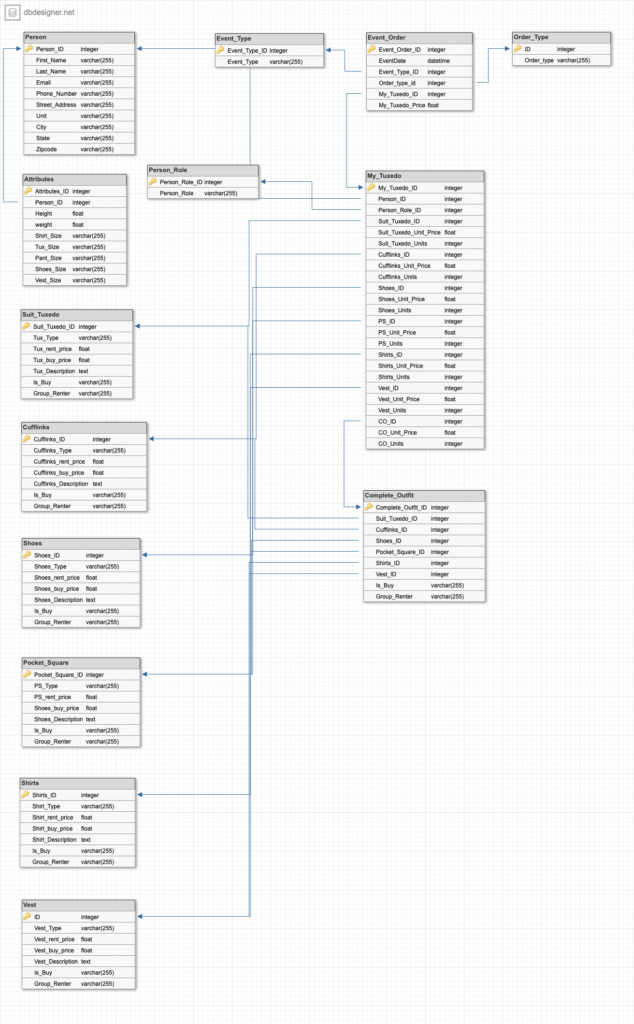
Database schema:
For this assignment, these are the main categories tables –
Customer information – Person, Attribute
Item information – Suit_Tuxedo, Shirts, Cufflinks, Pocket_Square, Shoes, Vest, Complete Outfit
Choice tables – Event_Type, Order_Type, Person_Role
Order Information related to the event and person – Event_Order, My_Tuxedo
The diagram below shows how each table is linked, primary keys, foreign keys, and type at a higher level related to each field in the table.
Link to diagram: https://app.dbdesigner.net/designer/schema/0-untitled-510f01fa-fb95-450e-89ef-a27c80423723
Choices for Is_Buy – Yes, No
Choices for Group_Renter – Yes, No
Order_Type table – Rent, Buy, Mix
Event_Type – Wedding, Prom, Special Event
Person Role – Groom, Groomsman, Bride, Guest
Assumption and scope:
Contact information is the same as billing and shipping information
Attributes table sizes can be their own tables.
Each accessory can have its own table and added to My_Tuxedo and Complete_Outfit. For assignment purposes, I have kept it limited to a few.
For simplicity, boolean fields like Is_Buy are kept varchar.
The length of each varchar field is kept at 255 for the simplicity of the assignment.
Choice tables are an example demonstration of how choices are made.
The dbdesigner does not support not crossing of lines well, that is a limitation of the application.
2. We need to be able to predict our sales and inventory based on our warehouse geography and booked rentals.
a. Write a SQL query against your proposed schema that will return the quantity of rentals of the shawl collar tuxedo by renter state for events on 2020-12-27.
b. Write an additional query to show how you would filter the expected results down to the top 3 zipcodes of the state that has the most rentals for the shawl collar tuxedo on 2020-12-27.
2a:
select count(ev.My_Tuxedo_ID)
from dbo.Event_Order ev
inner join Tuxedo mt on mt.My_Tuxedo_ID = ev.My_Tuxedo_ID
where mt.Suite_Tuxedo_ID = 1 and event_date = ‘2020-12-27’
group by EventDate
Note: Suite_Tuxedo_ID = 1 is where Tux_Type = ‘shawl collar tuxedo’
2b:
select top 3 count(ev.my_tuxedo_id) as sale, p.ZipCode
from Event_Order
inner join My_Tuxedo mt on mt.My_Tuxedo_ID = ev.My_Tuxedo_ID
inner join person p on p.Person_ID = mt.Person_ID
where (mt.Suit_Tuxedo_ID = 1 and EventDate = ‘2020-12-27’ and ev.Order_Type_ID = 1)
group by EventDate, ZipCode
order by sale desc
Note: Suite_Tuxedo_ID = 1 is where Tux_Type = shawl collar tuxedo
Order_Type_ID = 1 where Order_Type = Rent
3. We want to increase our AOV (average order value).
a. Based on the schema that you created above, write a SQL query that would provide the current AOV this year (2020).
b. If you were presented with this as a goal, what analysis would you want to do to help the company achieve this goal? You do not need to write out queries, but describe what analysis you would do to help the business figure out how to increase AOV. As part of this, you may suggest some possible solutions for increasing AOV, but the focus of your answer should be outlining how you would break down this problem and what analysis you would want to do to inform how the company would achieve this goal. For example, what would you look into to help the business understand the current state and identify opportunities of improvement. You are not limited to the data in the schema you designed, you may make assumptions about what data we reasonably would have about our customer and order history.
3a:
select sum(order_price)/count(my_tuxedo_id) as AOV
from event_order ev
where year(EventDate) = ‘2020’
Or
select avg(order_price) as AOV
from event_order ev
where year(EventDate) = ‘2020’
3b:
Business Recommendations (top 3 recommendation)
Assumption and scope: The Black Tux wants the rental business to grow, as that brings returning customers, referrals, increases CLV, and helps to increase AOV.
- Cross-selling:
- Encourage users to rent by focusing on complete fit as a basic package, and users can customize their outfits and add-on items.
- Upselling:
- Based on the assumption that 2 add-on items are strongly correlated with 1 basis point increase in AOV, we could set a roadmap target for the quarter to sell at least 2 add-on items per event resulting in potentially a 150% increase in AOV assuming 50 events per quarter.
- Incentivize the Purchase:
- If there are significant differences between these categories of buyers in increasing AOV, Black Tux might want to consider a different rental or buying model like offering rental items to be bought after a certain period of time.
Understand baseline data and what is impacting AOV
- Rent vs. buy
- Custom outfit vs. à la carte items
- Individual vs. Group rentals
Next Steps (further explore): list 4
- Off-season vs. peak season
- Which events are the most revenue-generating?
- Try-on: Home vs. Showroom
- Logistics and Supply Chain
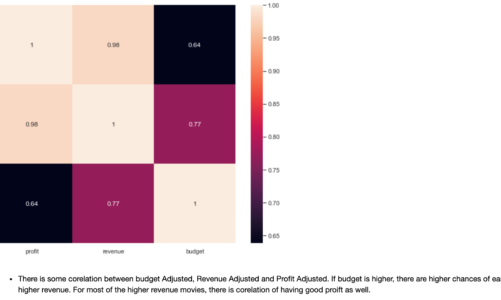
Preliminary Analysis (Correlation Analysis)
We want to identify Large positive, medium positive, no / weak, and negative correlation among variables to understand how we can increase AOV.
- Rent vs. buy – Rent vs. Buy and AOV correlation with other variables like the outfit, group rentals, season, events, omnichannel, eCommerce, logistics, and supply chain.
- Custom outfit vs. à la carte items – Correlation between custom outfit ordered and add-on items to increase AOV, Correlation between customer classification and AOV
- Individual vs. Group rentals – Correlation to increase in AOV to identify individuals vs. group rentals.
Next Steps (further explore): list 4
- Off-season vs. peak season – Correlation to increase in AOV during the off-season and what is that different from peak season.
- Which events are the most revenue-generating? – Understand which events are helping us to increase AOV.
- Online vs. Showroom Try-on – Correlation between in-store try-on and eCommerce to help us increase AOV.
- Logistics and Supply Chain – Correlation between the increase in AOV and our shipping timeline, the correlation between the availability of sizes, styles. Check abandoned carts, and order value if there is any correlation.
Assumption and scope: We have not considered deep-dive statistical analysis (like T-test Analysis, Z-test Analysis, ANOVA Analysis, and Regression Analysis), and A/B testing at this point.
Break down potential further business questions to analyze
- Rent vs. buy
- Compare rent vs. buy for various customer segments and classifications.
- The number of referrals, returning customers, and frequent buyers.
- AOV and CLV of rent vs. buy
- The pattern of outfits for groomsmen the same or different, with rent and buy analysis.
- Custom outfit vs. à la carte items
- How custom outfits are helping us with AOV? Would customers like to upgrade and add add-on items? What is the AOV of à la carte items outfit?
- What add-on items are popular and increase AOV? Which tuxedos and sizes are most rented?
- Individual vs. Group rentals
- Percentage difference of AOV from individual vs. Groups?
- How many referrals, acquisitions, and returning customers based on each?
- Customer classification, person and segmentation analysis
- Who visits our website first? Bride, groom, individual renter, group renter?
- Who makes the purchase and based on that who rents in the group?
Next Steps (further explore): list 4
- Off-season vs. peak season
- What is the peak season vs. off-season?
- How can we increase AOV during the off-season? How can we add a new stream of revenue and identify events and target customers to sell during the off-season?
- How can we meet the demand for inventory during the peak season?
- Logistics and Supply Chain
- How many days do we take to ship the order or try-on? Are customers satisfied with our delivery timeline, how packages and items are received?
- How do we manage our demand for try-on and rentals by shipping to different addresses?
- How do we manage our inventory and meet the demand for rentals?
- How overall experience will help us to increase AOV?
- Abandoned carts and closing of the sale to increase AOV.
- Which events are the most revenue-generating?
- Is that wedding helping to increase AOV? As the groom will recommend groomsmen to rent/buy from the same place or follow the theme? Also, weddings are a great opportunity to upsell to guests, there could be more than one sub-events.
- Which other events of such sizes can give us an opportunity to have to increase AOV, find referrals, and returning customers?
- Online vs. Showroom Try-on
- Is it convenient to place an online order or do they prefer to go to a showroom and seek advice and recommendations from a stylist?
- Do they purchase custom outfits or add more à la carte items? Opportunities to upsell and how. What are the challenges?
- Customer segmentation, person, and classification analysis.